You May Also Enjoy
Welcome to Jekyll!
less than 1 minute read
You’ll find this post in your _posts directory. Go ahead and edit it and re-build the site to see your changes. You can rebuild the site in many different wa...
Test working
less than 1 minute read
Test working
Test two
1 minute read
Here are two formulas
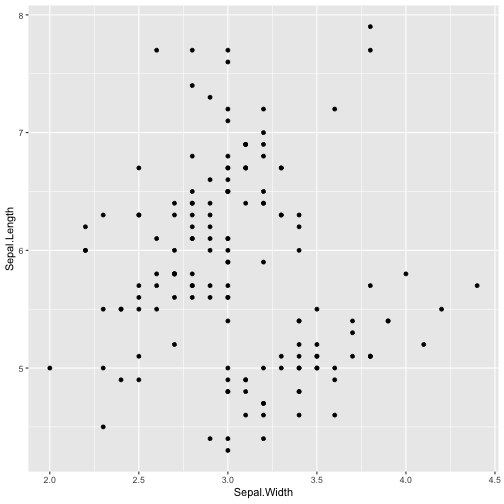
Hello Math!
less than 1 minute read
This is my first plot that cointains nice formulas